City of Barberton
Recent News About City of Barberton
-

On Father's Day this year, shelf the tie and get your dad something he really needs at your Summit County Ace Hardware!
Your participating Summit County Ace has great gifts for dad this year.
-

Yoga By the Lake
Learn the practice of yoga on the beautiful shores of Lake Anna Park. Bring a mat and a drink.
-

CITY OF BARBERTON WALK OF FAME
CITY OF BARBERTON WALK OF FAME
-

White Rabbit Galleries celebrates their First Anniversary!
White Rabbit Galleries celebrates their First Anniversary!
-

Check out Barberton's 2022 summer concert series, events, and programs!
Check out Barberton's 2022 summer concert series, events, and programs!
-

The City of Barberton offices will be CLOSED Monday, May 30, 2022 in observance of Memorial Day.
The City of Barberton offices will be CLOSED Monday, May 30, 2022 in observance of Memorial Day.
-
.jpg)
The City of Barberton is a proud participant of the Summit Bike Share program!
The City of Barberton is a proud participant of the Summit Bike Share program!
-
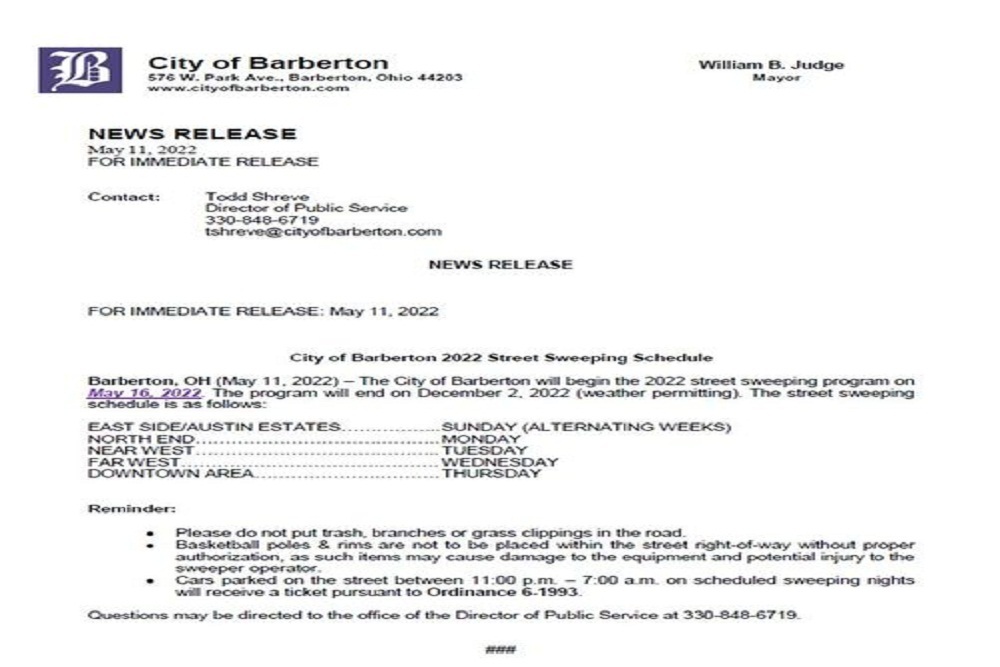
Press Release: Street Sweeping
PRESS RELEASE: STREET SWEEPING
-
Mayor William B. Judge is currently seeking an Administrative Coordinator with a background in Communications
Mayor William B. Judge is currently seeking an Administrative Coordinator with a background in Communications.
-
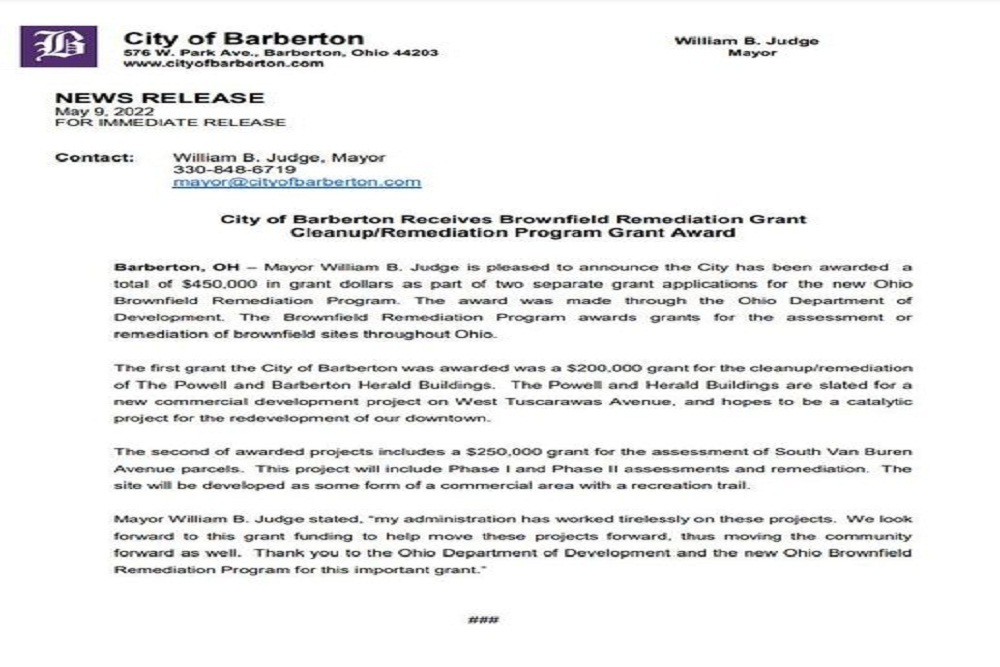
City of Barberton Received Brownfield Remediation Grant Cleanup/Remediation Program Grant Award
PRESS RELEASE: City of Barberton Received Brownfield Remediation Grant Cleanup/Remediation Program Grant Award
-
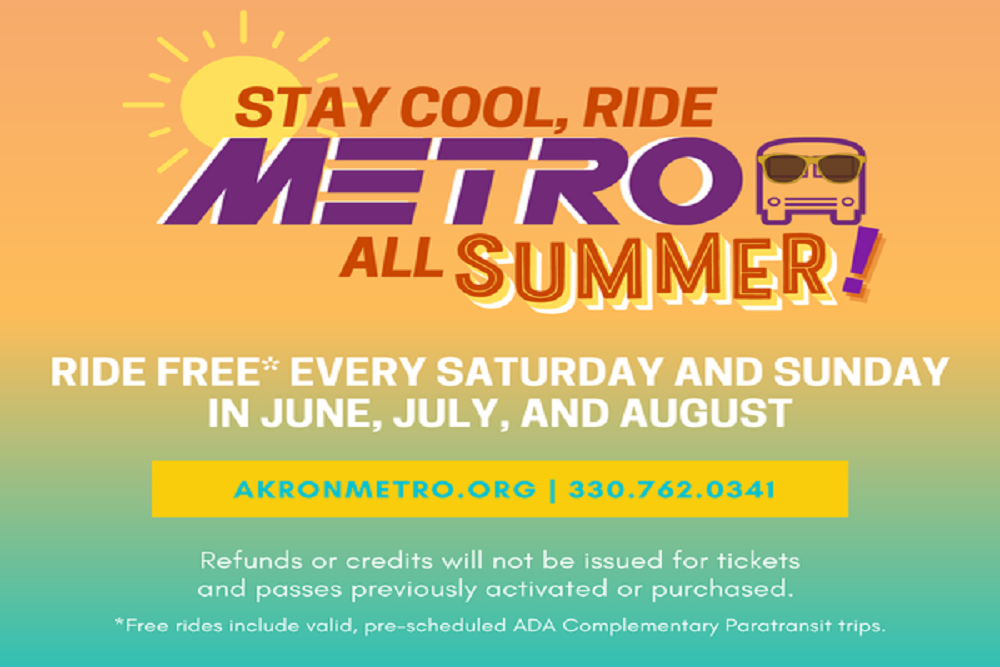
Metro is offering fare-free rides every Saturday and Sunday in June, July, and August!
Metro is offering fare-free rides every Saturday and Sunday in June, July, and August!
-
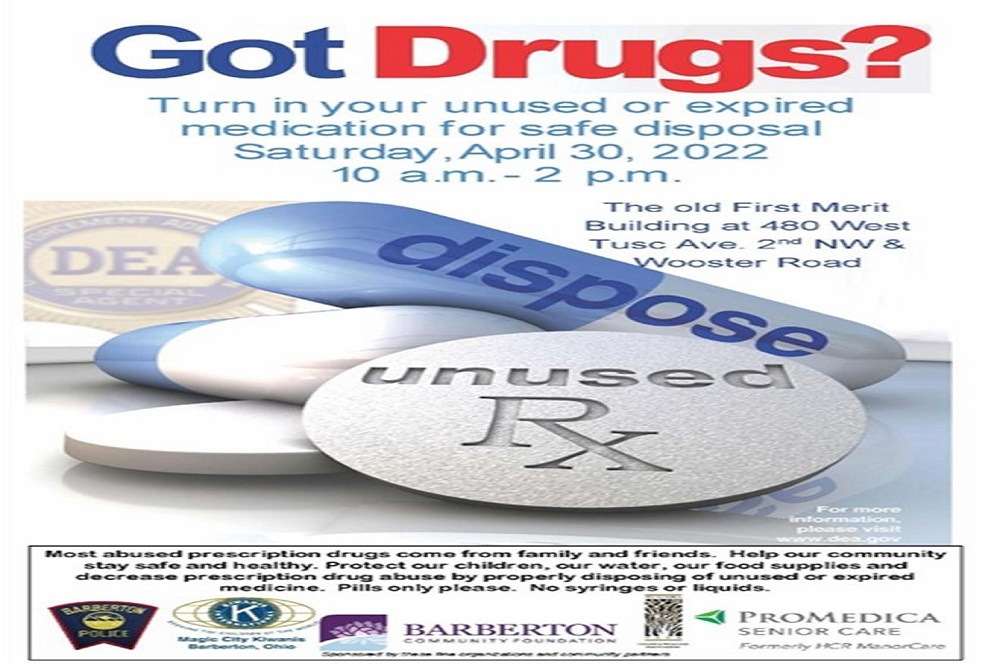
National Drug Take Back Day is scheduled for Saturday, April 30, 2022
National Drug Take Back Day is scheduled for Saturday, April 30, 2022 from 10:00 AM to 2:00 PM in the parking lot at the former First Merit Building, located at 480 W. Tuscarawas Avenue.
-
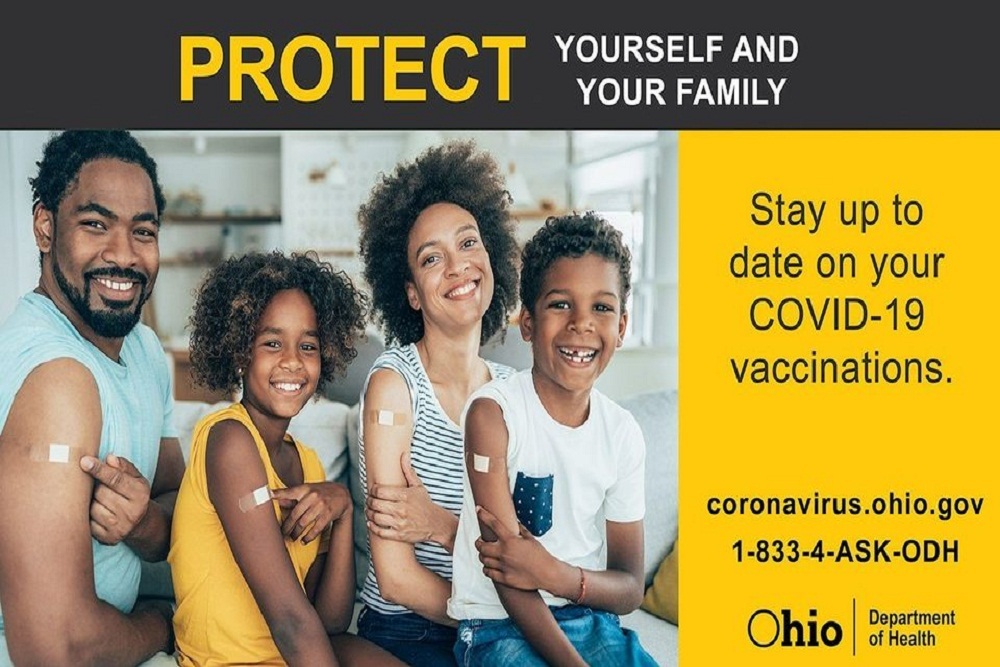
Drive-Thru Vaccination Clinic @ SCPH 1867 W Market St, Akron, OH 44313
Drive-Thru Vaccination Clinic @ SCPH 1867 W Market St, Akron, OH 44313
-
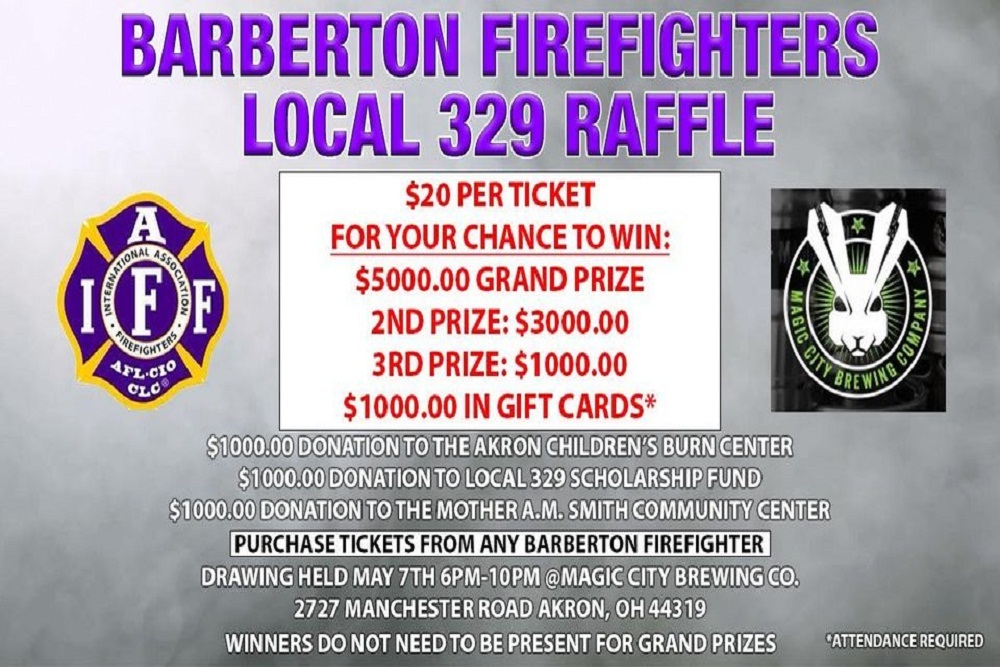
Barberton Firefighters Annual Local 329 Raffle will be held on Saturday, May 7th.
Barberton Firefighters Annual Local 329 Raffle will be held on Saturday, May 7th.
-
Nominations for the City of Barberton Walk of Fame are now being accepted by the Walk of Fame Committee.
Nominations for the City of Barberton Walk of Fame are now being accepted by the Walk of Fame Committee.
-

23.2 percent of people 25 or older have an associate's degree or higher in Barberton
23.2 percent of people 25 years or older had an associate's degree or higher in Barberton in 2020, according to data obtained from the U.S. Census Bureau.
-

ROAD CLOSURE: Graceland St will be CLOSED today between Glenn and Hiram
ROAD CLOSURE: Graceland St will be CLOSED today between Glenn and Hiram. Follow posted detours.
-
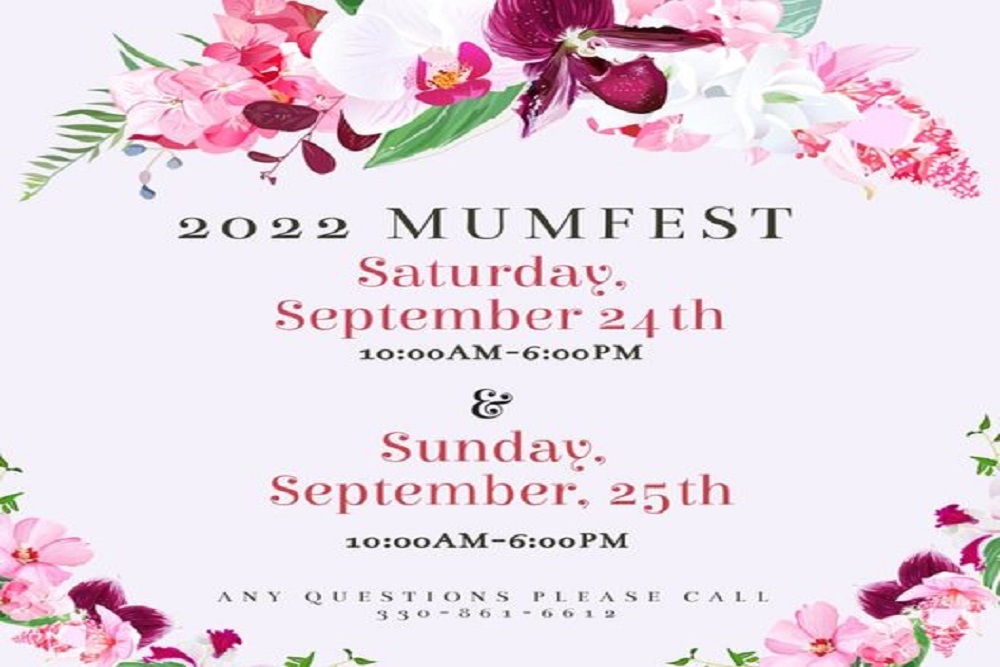
Mark your calendars for the 2022 Mum Festival!
The 2022 Mum Festival will be on Saturday, September 24th & Sunday, September 25th.
-
The Barberton Municipal Court Clerk of Court’s office is accepting applications for a full-time Deputy Clerk.
The Barberton Municipal Court Clerk of Court’s office is accepting applications for a full-time Deputy Clerk.
-

Magic Egg Hunt April 9
The 2022 Magic Egg Hunt will be held on April 9th from 10am-12pm.